Community Engagement Analytics: Top Tools and Metrics
Discover the best tools to analyze engagement in your digital community. Learn which metrics to track and how 9bot automates this analysis on WhatsApp.
What is Online Community Engagement?
We are living in the golden age of digital communities. They are everywhere: in WhatsApp groups, forums, Discord, corporate environments, and learning platforms. Creating a group is only the first step; the true long-term challenge lies in maintaining member engagement and active participation.
Engagement goes far beyond mere physical presence in the chat. It is about members' willingness to contribute, answer topics, interact with polls, and feel a genuine sense of belonging to the channel. According to leading researchers, real engagement is the consolidation of recurring actions: the frequency and quality of shared texts, the response rate to initiated topics, the sharing of useful materials, and overall reactions in the chat.
Real Engagement vs Passive Presence: A healthy community is made of active participants who create cooperative value, not silent contacts who just view messages passively.
In the context of modern management with 9bot, we deal daily with administrators interested in measuring these actions. Tracking member engagement allows you to anticipate churn risks, identify brand advocates (super-users), and adjust operational strategies at the right time.
Why Measure Engagement?
You can only improve what you can measure with scientific precision. Community administrators who do not measure participation data operate in the dark, unable to know if their content dispatches are having an effect or if their base is about to silence the group.
According to comprehensive research on digital environments, continuously analyzing engagement in digital spaces and social networks allows you to understand behavioral patterns, predict sudden activity drops before members leave, plan perfectly timed re-engagement topics, and avoid message overload (visual fatigue) that drives users away.
The Problem in Practice
The lack of monitoring and active analysis tools leads to severe losses in channel management:
- Undetected Silent Churn: Without retention metrics, the administrator does not realize that dozens of members have stopped interacting, discovering the problem too late when they have already left the channel.
- Operational Waste of Topics: Sharing valuable content at the wrong times or on topics unwanted by the majority reduces business conversion to zero.
- Physical Exhaustion of the Moderator: Trying to manually watch and note in notebooks who participates most and the daily volume of conversations in highly populated channels is physically impossible and prone to severe errors.
- Delayed Responses to FAQs: The latency between a lead's question and the moderator's manual response destroys the customer experience and cancels sales.
What You Will Configure and Solve
In this practical guide, you will learn to enable the analytical reporting ecosystem in the 9bot Dashboard to:
- Track real-time activity charts and message volume.
- Audit individual contributions and identify inactive members.
- Evaluate the performance and responses to scheduled poll dispatches.
- Optimize peak hours based on network traffic reports.
Before You Begin
- An active WhatsApp group properly paired with the 9bot console.
- An administrative account with read and report permissions enabled in the panel.
- The bot configured as an administrator in the official WhatsApp application permissions.
- A scheduled engagement test plan to evaluate the initial telemetry.
Step-by-Step in the Dashboard
Step 1: Analyze Global Traffic in the Reports Tab
- Log in to the 9bot Dashboard and select the target corporate WhatsApp group.
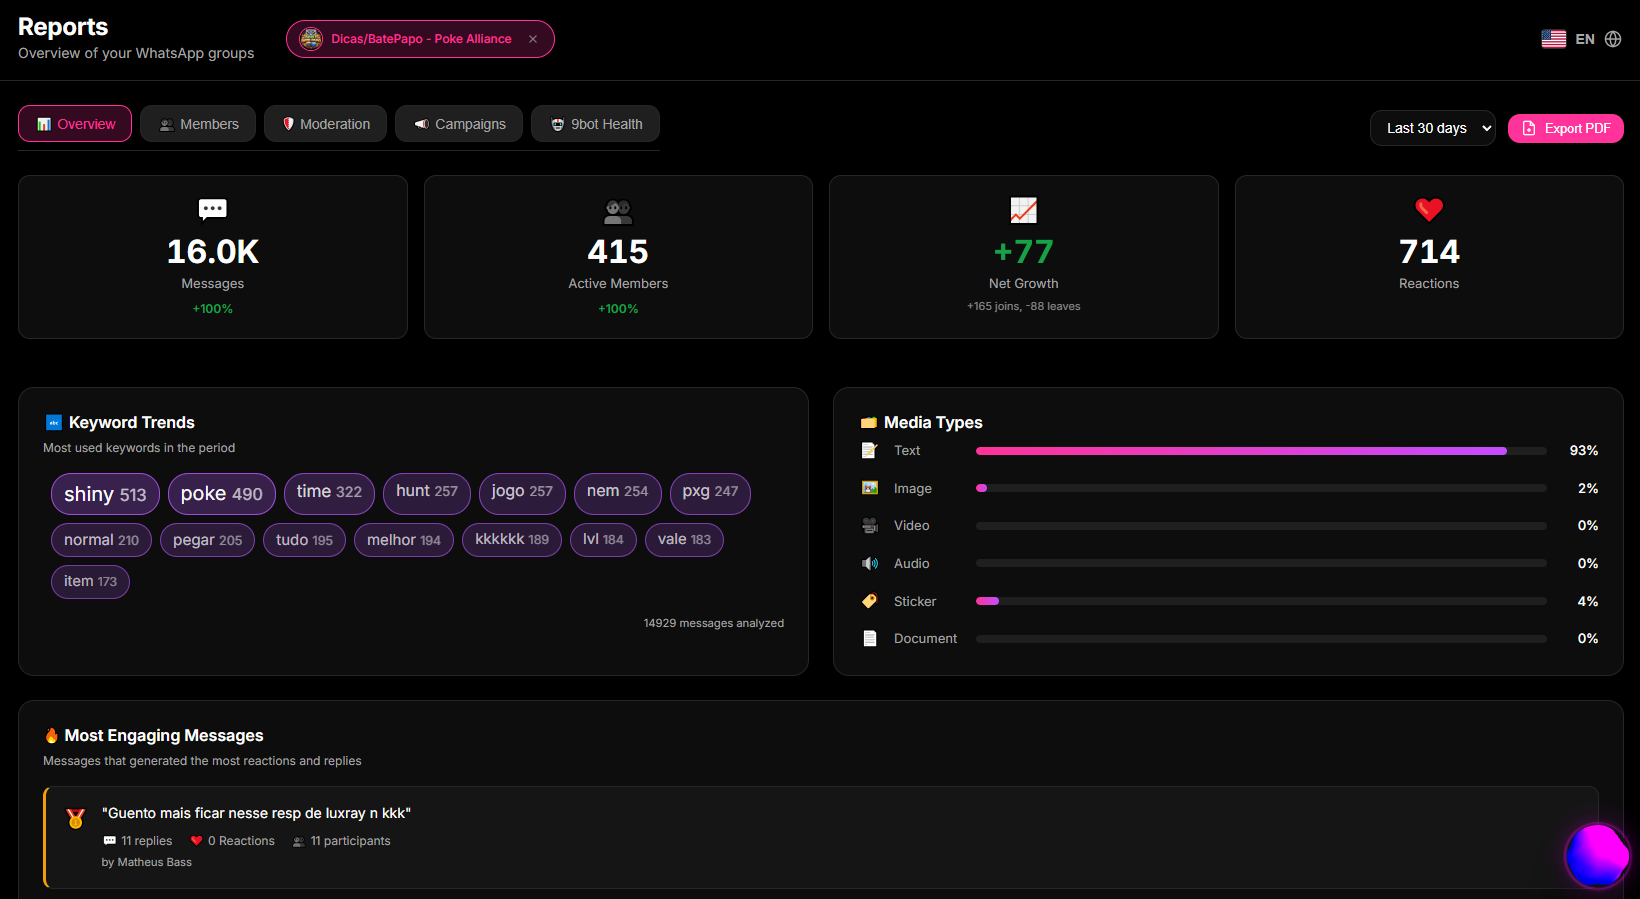
- In the side menu, click the Reports tab and access the Overview section.
- Here, you will view dynamic traffic charts, indicating the number of messages processed per hour, daily member growth, and peak interaction periods.
- Use this data to plan your announcement or poll dispatches exactly during historical peak network traffic minutes.
Quick Checkpoint: Verify the activity-by-period chart and identify the highest traffic hour in the group over the last 48 hours. Schedule a quick test poll for this peak period and observe the instant variation in metrics.
Step 2: Audit Individual Engagement in the Members Tab
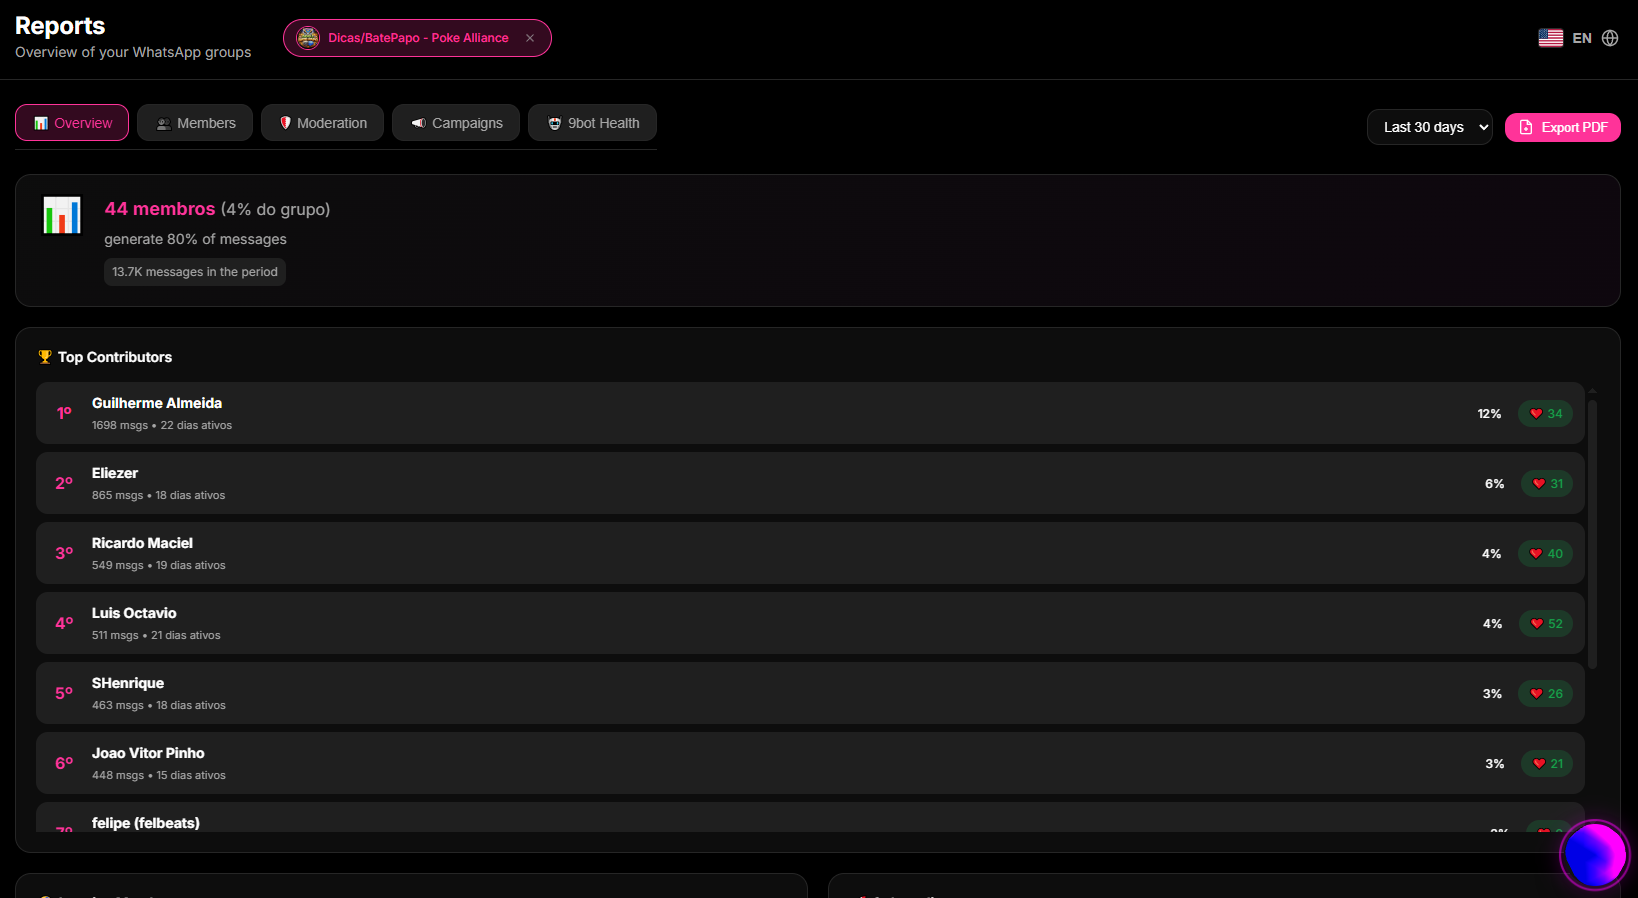
- In the console navigation menu, click the Members tab.
- In this active directory hub, sort participants by the volume of sent messages or by the date of their last physical interaction in the group.
- Identify the most active members (community advocates) to reward them or highlight them in the chat.
- Locate members with zero messages sent in the last 30 days (inactive nodes) and use the bot to catalog these accounts and prepare specific interest-reactivation strategies.
Quick Checkpoint: Filter inactive users in the panel and make sure that the individual message count accurately reflects the physical inactivity observed in the mobile app.
Step 3: Enhance Active Engagement with Polls and Scheduling
- Based on the metrics observed in the previous steps, access the Scheduling tab and then Create Schedule.
- Instead of forcing manual text dispatches, program the recurring delivery of dynamic multiple-choice polls focused on the topics identified as high-interest in the reports.
- Monitor the aggregated vote count and the average response time (latency) of participants in the panel to verify the automation's efficiency.
How It Works in Practice
Trying to manually monitor member engagement and activity in a large group is like a store owner trying to measure their business's success just by looking through the window and trying to remember which customers visited today, who bought something, who just browsed, and who never returned. In groups with hundreds of people chatting all day, visual tracking is impossible and leads to serious judgment errors.
With 9bot's Metrics and Reports, you get an intelligent and detailed management dashboard for your community. The bot automatically analyzes which members are most active, peak messaging hours, and which participants have been silent for weeks. These clear statistics appear in your dashboard instantly, allowing you to make decisions based on real data: sparking conversations at the right times, rewarding active members, or re-engaging those who have been quiet.
Test It Now in Your Group
- Access the 9bot Reports Dashboard and identify the highest conversation flow hour in the last 24 hours.
- Schedule an interactive quiz or poll containing buttons for 5 minutes before this peak traffic hour.
- Track the traffic chart curve in real time in the Dashboard during the receipt of participant votes.
- Verify in the Members tab if the test votes and contacts were properly recorded in the individual activity aggregate records.
If the behavioral data and charts responded instantly to each interaction in the test chat, your community analytical ecosystem is active and ready to accelerate your conversions!
Read also
Frequently Asked Questions
What are community engagement analysis tools?
How does 9bot help identify inactive members and prevent churn in groups?
Is it possible to know which topics arouse the most interest in the WhatsApp group?
Is report data telemetry on WhatsApp updated in real time?