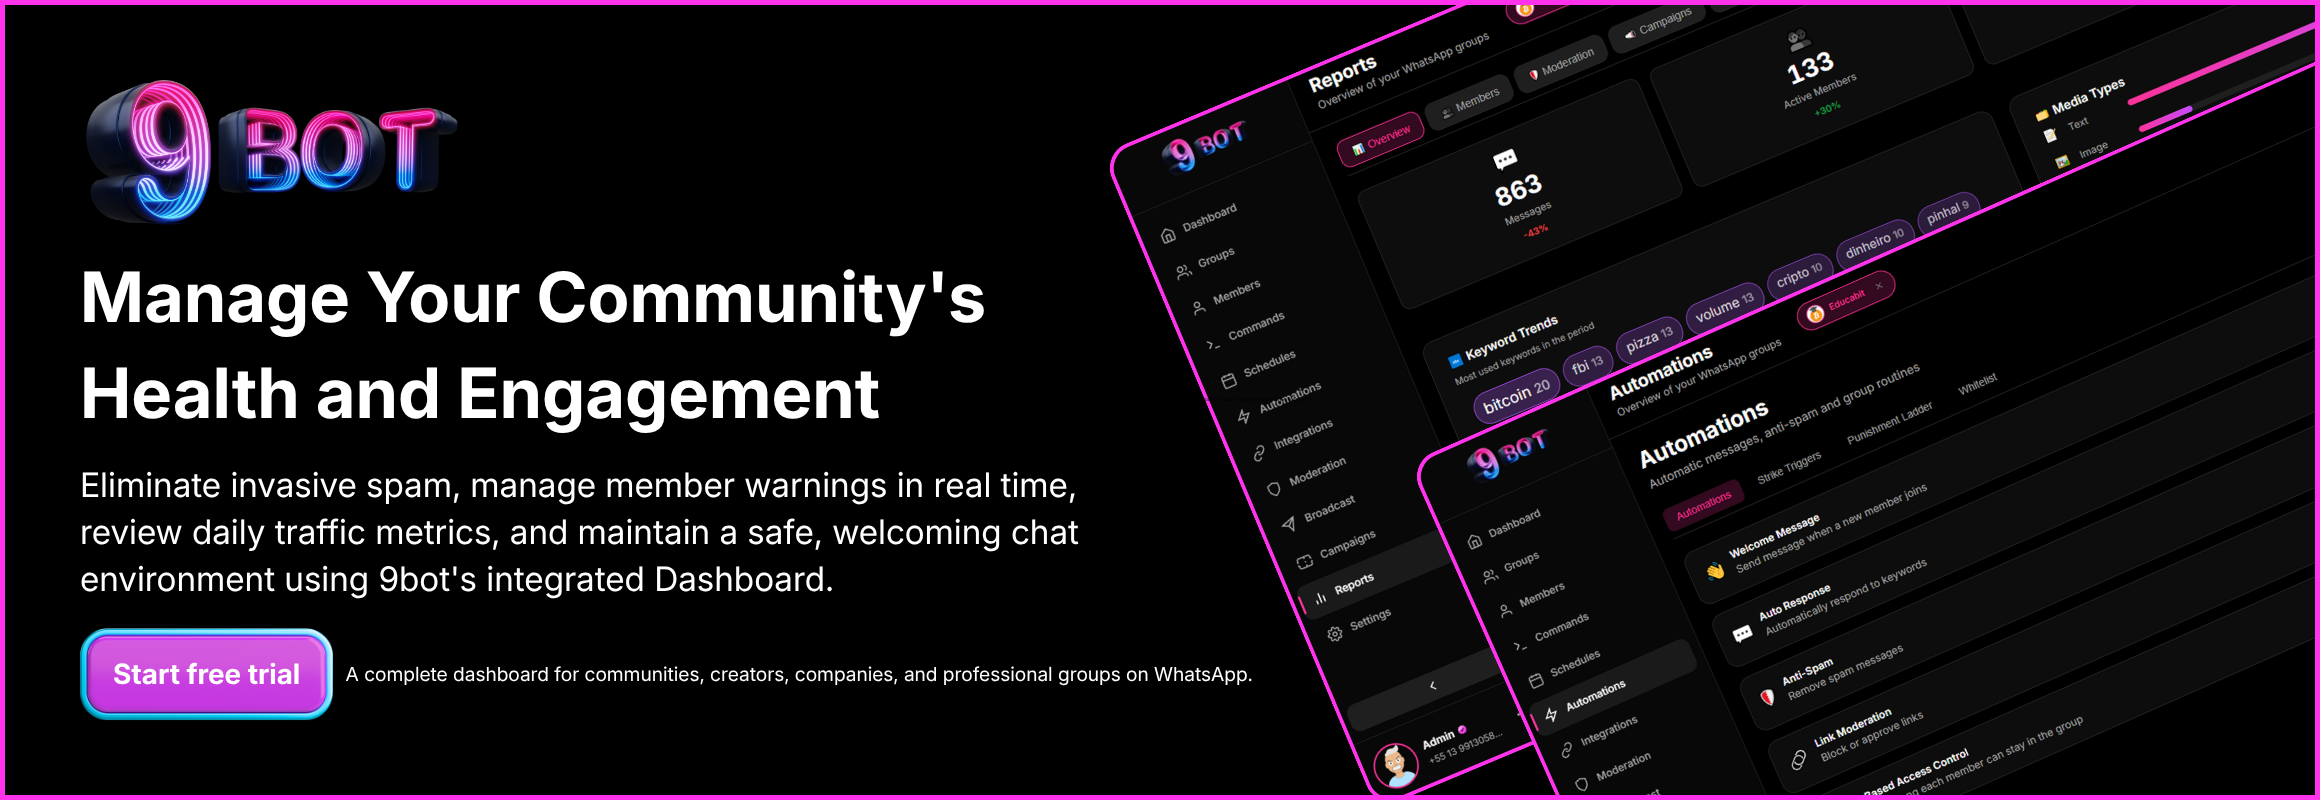
How to Measure WhatsApp Group Success with Relevant Metrics
Eliminate guesswork in your community. Learn to track and interpret the most relevant metrics using 9bot's automatic reports to ensure a healthy group.
The challenge of auditing and understanding community health
Anyone who manages digital communities on WhatsApp quickly realizes a simple yet defining detail for the success of their operation: it is not enough to just gather hundreds of people in a chat; it is crucial to know if the group is actually fulfilling its editorial and commercial purpose. As communities grow in size and gain strategic importance for creators, brands, and content portals, monitoring this environment becomes an indispensable differentiator.
However, measuring community success is often clouded by guesswork. Many administrators believe that a group with dozens of notifications flashing every second is a sign of absolute success, when in reality, this frantic message volume might be dominated by just two or three highly talkative participants or spammers, while the vast majority of members remain inactive or even annoyed by the excessive visual noise.
To gain assertive insights and guide the group proactively, you must learn to look beyond superficial traffic. Smart data analysis allows you to identify the real behavior of members and apply structural improvements before disinterest leads to a general stampede of the audience.
The problem in practice
A lack of objective data and managing based solely on visual perception create major bottlenecks for the manager:
- Illusion of total volume: A huge number of exchanged messages can give a false impression of engagement, hiding prolonged silence from most members and quiet dissatisfaction.
- Unexpected mass exit: Without tracking the retention rate and daily joins and leaves, the administrator is surprised by a sudden stampede of participants without understanding the real cause.
- Decisions based on guesswork: Making structural changes to the topic or rules without behavioral data drains the moderation's energy and can cause severe backlash in the community.
Structured data is the only reliable gauge to diagnose and cure widespread disinterest in the chat.
What you will configure and resolve
In this operational guide, you will learn to collect, interpret, and use consolidated data in the 9bot Dashboard to:
- Map the actual ratio of active members and passive participants.
- Evaluate peak times and schedule posts during high-engagement hours.
- Identify "silent" participants to create focused onboarding and reactivation campaigns.
- Track the attractiveness of links, news, and dynamics shared in the chat.
Before starting
- Full administrative access to the 9bot Dashboard.
- An active WhatsApp group connected to your panel.
- The 9bot helper successfully promoted to administrator in the respective group.
- Simple goals defined (e.g., increase by 15% the number of members participating in weekly discussions).
Step-by-step in the Dashboard
Step 1: Monitor group behavior in the reports panel
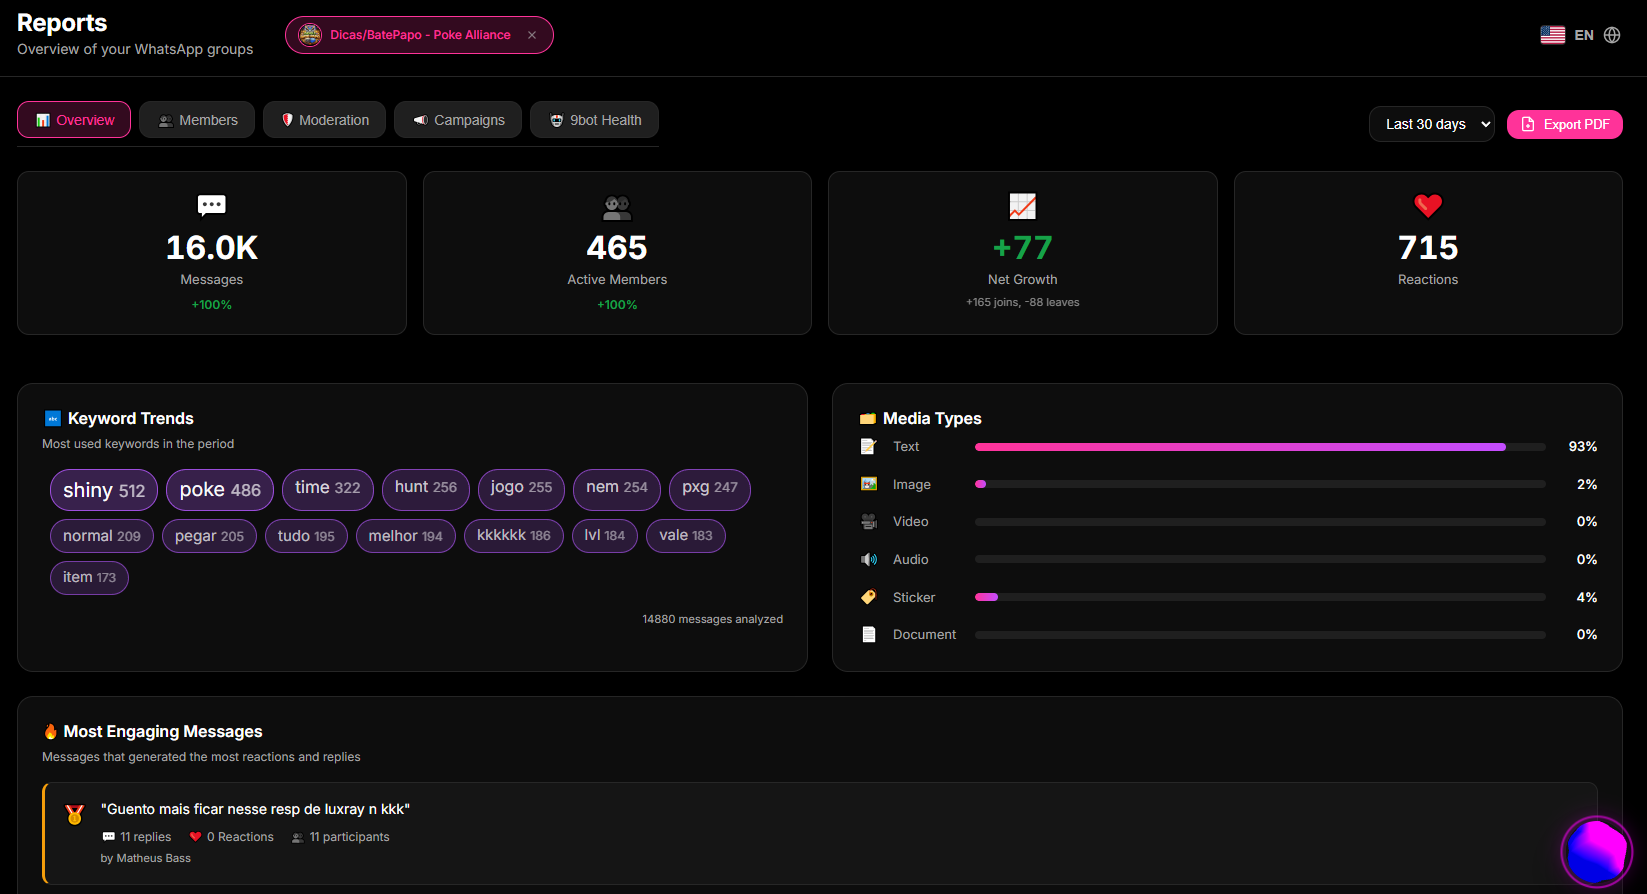
- Access the 9bot Dashboard and go to the Reports > Overview menu.
- Analyze the consolidated daily message graphs to identify the times and days of the week with the greatest natural interaction flow from members.
- Observe the daily active users graph and cross-reference it with the total participant count to obtain the group's real engagement rate.
- Use these hourly trends to plan high-value posts and broadcasts, avoiding sending important messages during periods of complete silence.
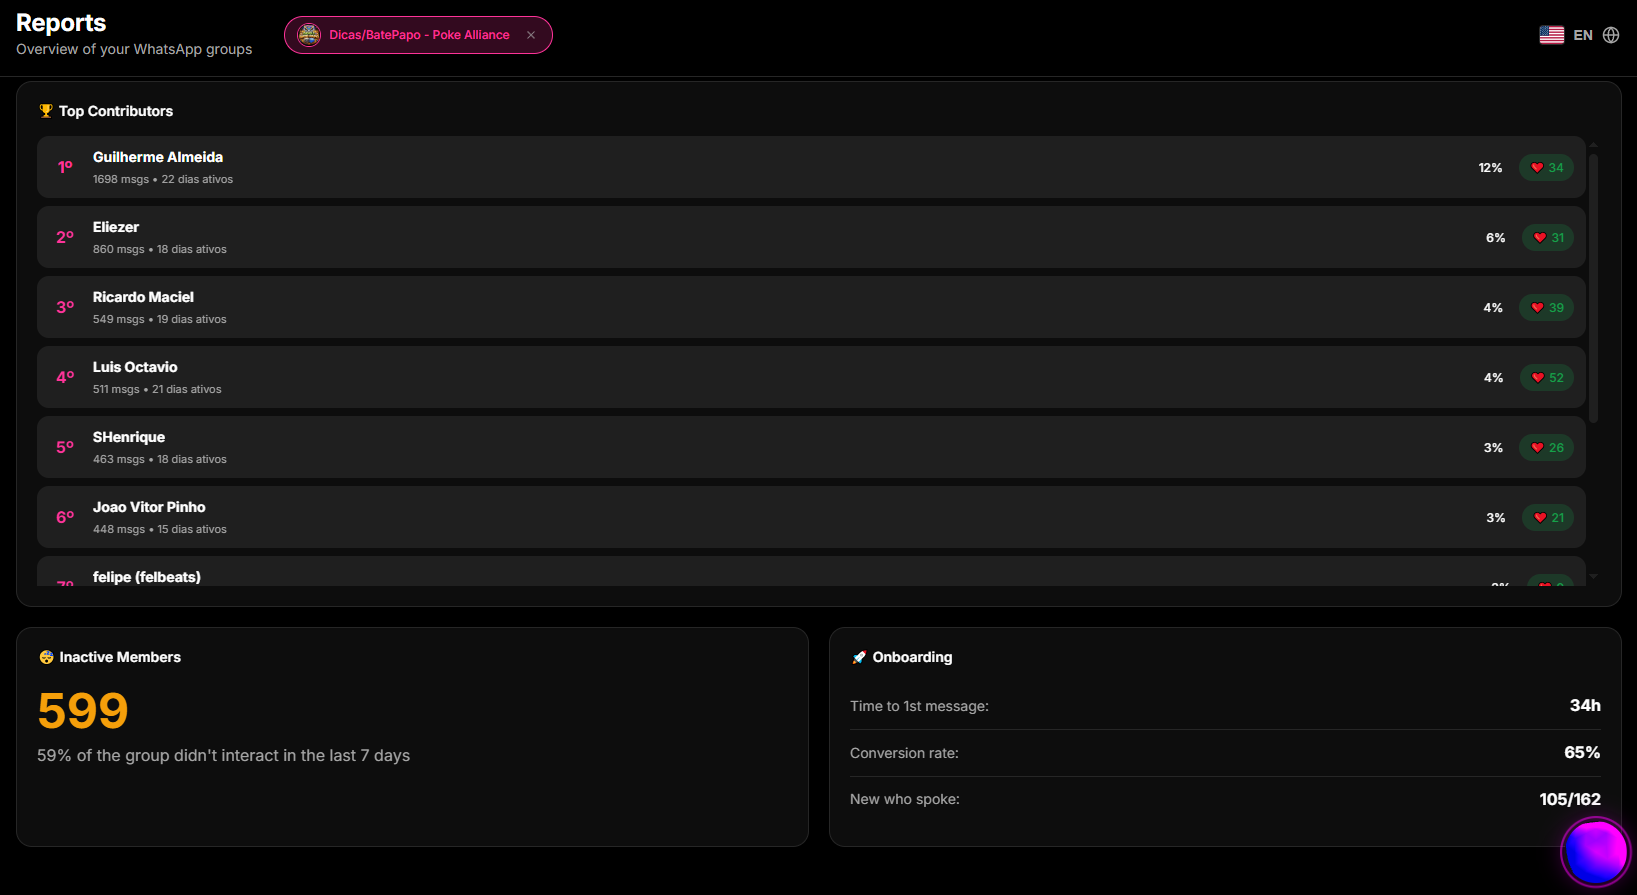
Step 2: Audit inactive members and plan activation actions
- On the 9bot panel, access the Members menu in the sidebar navigation.
- Use the consolidated participant list to filter and export the active and inactive user list for specific periods.
- Identify VIP members or group influencers who have recently gone silent to send targeted outreach messages or focused dynamics.
- Save this list to compare the effectiveness of new engagement campaigns weekly.
Audit Warning: Cumulative inactivity of over 75% of members indicates that the community has turned into a passive list. It is time to re-engage the group with dynamic content.
Step 3: Implement listening loops using polls and triggers
- With consolidated inactivity data, access the Commands > Custom Commands menu to create dynamic polls.
- Design a quick native poll (triggers like `/poll` or `/vote`) to collect participants' opinions on new topics or discussion themes.
- Activate moderation filters in the Automations tab to prevent spammers from polluting the chat when you encourage spontaneous human interaction from legitimate members.
- Analyze the impact of these polls on the engagement curve in the following weeks through the reports panel.
Setup Warning: Do not leave polls running indefinitely. Set the poll duration trigger to encourage prompt, dynamic responses.
How it works in practice
Managing a WhatsApp group without analytics is like driving a high-speed vehicle on a dark highway at night with a completely blacked-out dashboard—no speedometer, no warning lights, and no fuel gauge. With 9bot, it's like using a live analytics suite and telemetry dashboard. You track exact metrics in real-time: daily message flow volumes, active vs. inactive user ratios, member retention curves, and link click-through conversion rates. Every operational decision is backed by concrete statistical reports rather than guesswork.
Test it now in your group
- Access the Reports > Overview tab in your 9bot Dashboard.
- Identify in the tables the most active participant and the day of the week with the lowest message flow in the last fortnight.
- Schedule a high-value content test broadcast in the Scheduling tab specifically for the historically lower-activity day, seeking to warm up the chat.
- Monitor whether the report graphs accurately captured the variation in engagement in the days following the test.
If the data and daily engagement variations could be read clearly on your admin panel graphs, your smart float system is active and ready to guide your brand's success!
Read also
Frequently asked questions
What are relevant metrics for groups?
How do I choose metrics for my group?
Which metrics indicate success in groups?
Is it worth measuring group engagement?
How do I track the evolution of these metrics?