How to analyze community engagement on WhatsApp: tools and steps
Discover the best tools to analyze engagement in your digital community. Learn which metrics to track and how 9bot automates this analysis on WhatsApp.
How it works in practice

Step by step in the 9bot dashboard
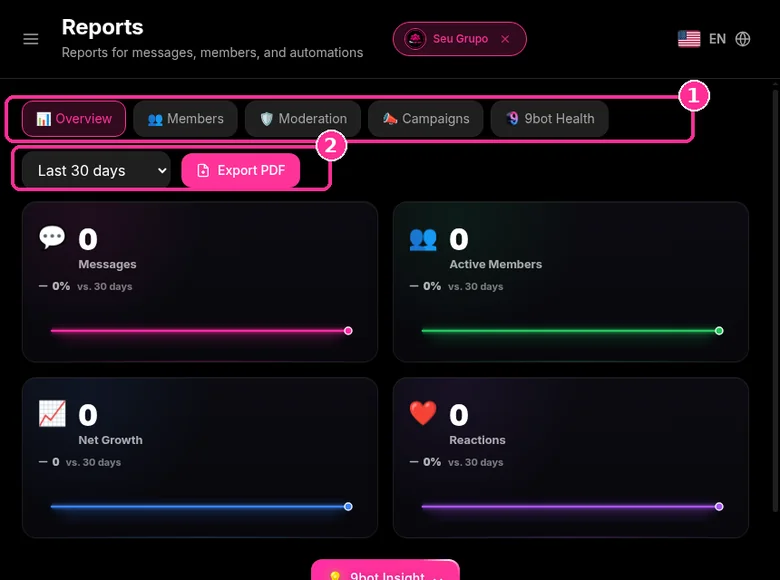
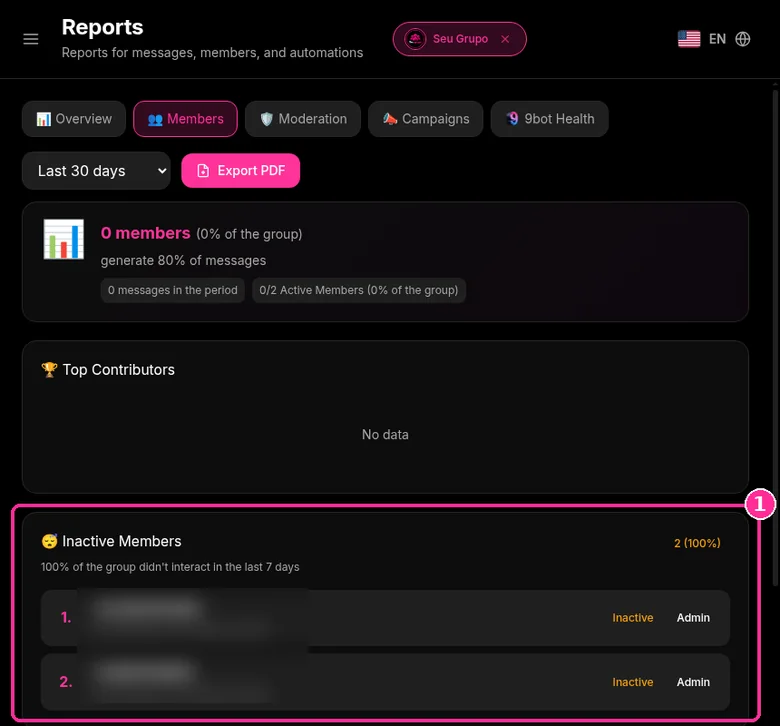
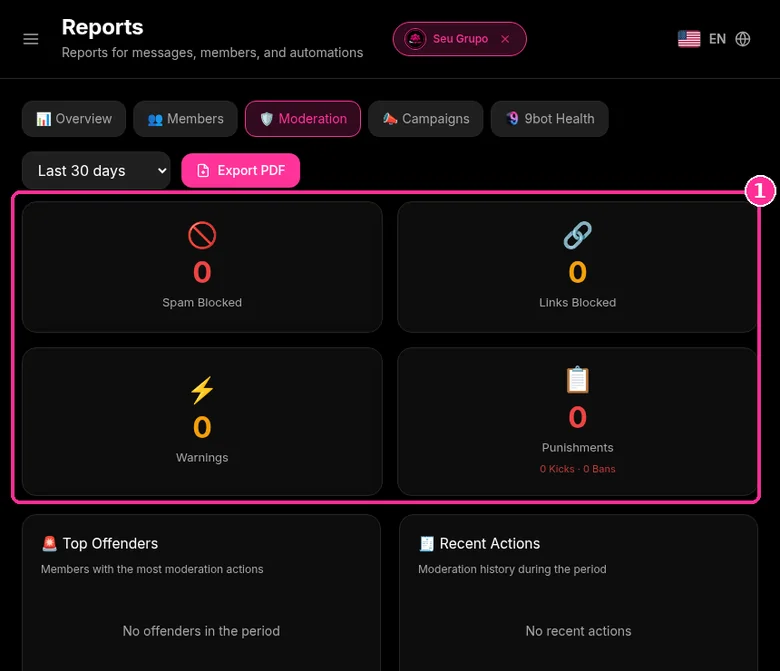
In the side menu, open Reports ("Reports for messages, members, and automations"). The screenshots below come from the real dashboard, in a test group called "Seu Grupo", with member names and contacts blurred. The numbers on the images follow the order of the clicks.
Before you start, the group must be connected to the 9bot dashboard and the bot must be a group admin in WhatsApp.
Step 1: Pick the tab and period
- Choose the tab: Overview, Members, Moderation or Bot Health.
- In the period selector, choose for example Last 30 days.
- Use Export PDF to keep or send the report.
- Overview shows Messages, Active Members, Net Growth and Reactions.
Step 2: See inactive members
- On the Members tab, the Inactive Members card lists who has not interacted in the last 7 days.
- The same tab shows Top Contributors.
Step 3: Track moderation
- On the Moderation tab, see Spam Blocked, Links Blocked, Warnings and Punishments.
- Below are Top Offenders and Recent Actions.
Step 4: Check bot health
- On the Bot Health tab, see Current Status, Uptime, Average Latency and Messages Processed.
- Processing Queue and Error Summary show what is pending or failed.
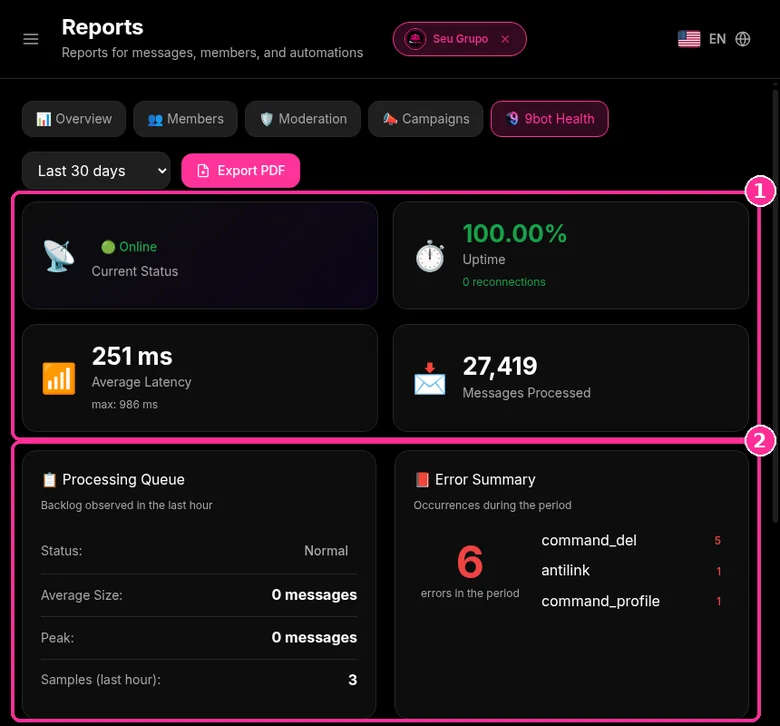
Want to try it in your group? See the 9bot plans with a 7-day trial.
About this guide: this one focuses on how to analyze engagement in practice and which tools to use. If you're not sure which numbers to track yet, start with WhatsApp group metrics: which KPIs to track to measure success.
To standardize the definition and formula of each indicator, see the WhatsApp metrics glossary.
What is Online Community Engagement?
We are living in the golden age of digital communities. They are everywhere: in WhatsApp groups, forums, Discord, corporate environments, and learning platforms. Creating a group is only the first step; the true long-term challenge lies in maintaining member engagement and active participation.
Engagement goes far beyond mere physical presence in the chat. It is about members' willingness to contribute, answer topics, interact with polls, and feel a genuine sense of belonging to the channel. According to leading researchers, real engagement is the consolidation of recurring actions: the frequency and quality of shared texts, the response rate to initiated topics, the sharing of useful materials, and overall reactions in the chat.
Real Engagement vs Passive Presence: A healthy community is made of active participants who create cooperative value, not silent contacts who just view messages passively.
In the context of modern management with 9bot, we deal daily with administrators interested in measuring these actions. Tracking member engagement allows you to anticipate churn risks, identify brand advocates (super-users), and adjust operational strategies at the right time.
Why Measure Engagement?
You can only improve what you can measure with scientific precision. Community administrators who do not measure participation data operate in the dark, unable to know if their content dispatches are having an effect or if their base is about to silence the group.
According to comprehensive research on digital environments, continuously analyzing engagement in digital spaces and social networks allows you to understand behavioral patterns, predict sudden activity drops before members leave, plan perfectly timed re-engagement topics, and avoid message overload (visual fatigue) that drives users away.
The Problem in Practice
The lack of monitoring and active analysis tools leads to severe losses in channel management:
- Undetected Silent Churn: Without retention metrics, the administrator does not realize that dozens of members have stopped interacting, discovering the problem too late when they have already left the channel.
- Operational Waste of Topics: Sharing valuable content at the wrong times or on topics unwanted by the majority can reduce the relevance of the content and members’ response to it.
- Physical Exhaustion of the Moderator: Trying to manually watch and note in notebooks who participates most and the daily volume of conversations in highly populated channels is physically impossible and prone to severe errors.
- Delayed Responses to FAQs: The latency between a lead's question and the moderator's manual response destroys the customer experience and cancels sales.
What You Will Configure and Solve
In this practical guide, you will learn to enable the analytical reporting ecosystem in the 9bot Dashboard to:
- Track real-time activity charts and message volume.
- Audit individual contributions and identify inactive members.
- Evaluate the performance and responses to scheduled poll dispatches.
- Optimize peak hours based on network traffic reports.
Engagement beyond the shop window
Trying to manually monitor member engagement and activity in a large group is like a store owner trying to measure their business's success just by looking through the window and trying to remember which customers visited today, who bought something, who just browsed, and who never returned. In groups with hundreds of people chatting all day, visual tracking is impossible and leads to serious judgment errors.
With 9bot's Metrics and Reports, you get an intelligent and detailed management dashboard for your community. The bot automatically analyzes which members are most active, peak messaging hours, and which participants have been silent for weeks. These clear statistics appear in the available dashboard reports, allowing you to make decisions based on real data: sparking conversations at the right times, rewarding active members, or re-engaging those who have been quiet.
Test It Now in Your Group
- Access the 9bot Reports Dashboard and identify the highest conversation flow hour in the last 24 hours.
- Schedule an interactive quiz or poll containing buttons for 5 minutes before this peak traffic hour.
- Track the traffic chart curve in real time in the Dashboard during the receipt of participant votes.
- Verify in the Members tab if the test votes and contacts were properly recorded in the individual activity aggregate records.
Check the period and records available in the dashboard. Do not assume that every event is consolidated instantly; confirm that the data has updated before comparing results.
How can a team build a business review of its groups?
A useful review connects group data to team decisions. Use the same date range, record each group's purpose and compare with the previous period. Reports help locate changes; interpretation should account for campaigns, calendar effects and rules. Do not treat activity as proof that members read a message or made a purchase.
- In Reports, select the period and record which groups are included.
- In Overview, review available indicators such as messages, active members, net growth and reactions.
- In Members, check the inactivity definition and member contributions. Do not silently mix a fixed inactivity window with another reporting period.
- In Moderation, review blocks, warnings and penalties by type. Different event counts are not necessarily distinct incidents.
- Record the hypothesis, owner and next action in a team worksheet. Export the report PDF when you need to preserve the period's evidence.
| Review field | What to record |
|---|---|
| Group and purpose | Internal name and operational goal |
| Period and source | Selected dates and report |
| Observed change | Current and previous value under one definition |
| Hypothesis | A possible explanation, not assumed causation |
| Next action | A rule, topic, frequency or routine to adjust |
| Owner and review | Who follows up and when the decision is reviewed |
This is a proposed management worksheet, not a promised new native portfolio dashboard. Use group metrics for formulas and moderation cost to assess team time.
Read also

Frequently Asked Questions
Can I export the group report as a PDF?
What are community engagement analysis tools?
How does 9bot help identify inactive members and prevent churn in groups?
Is it possible to know which topics arouse the most interest in the WhatsApp group?
Is report data on WhatsApp always updated in real time?
Does group activity prove that a campaign generated sales?